分類問題の評価指標
Contents
分類問題の評価指標
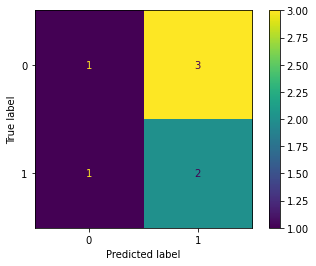
混同行列 (Confusion Matrix)
from sklearn import metrics

y_true = [0, 1, 1, 0, 0, 1, 0]
y_pred = [1, 1, 1, 1, 1, 0, 0]
metrics.confusion_matrix(y_true=y_true, y_pred=y_pred)
array([[1, 3],
       [1, 2]])
混同行列の描画には sklearn.metrics.ConfusionMatrixDisplay を使うのが便利です。
metrics.ConfusionMatrixDisplay.from_predictions(y_true=y_true, y_pred=y_pred)
<sklearn.metrics._plot.confusion_matrix.ConfusionMatrixDisplay at 0x7f1c47d47fd0>
適合率 (Precision) と再現率 (Recall)
参考: https://scikit-learn.org/stable/auto_examples/model_selection/plot_precision_recall.html
from sklearn import metrics

y_true = [0, 1, 1, 0, 0, 1, 0]
y_pred = [1, 1, 1, 1, 1, 0, 0]

metrics.precision_score(y_true=y_true, y_pred=y_pred)
0.4
from sklearn import metrics

metrics.recall_score(y_true=y_true, y_pred=y_pred)
0.6666666666666666
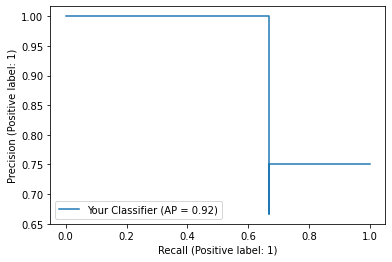
適合率・再現率曲線 (Precision Recall曲線, PR曲線)
from sklearn import metrics

y_true = [1, 1, 0, 1, 0, 0, 0]
y_score = [0.9, 0.8, 0.88, 0.98, 0.5, 0.4, 0.3]

precision, recall, threshold = metrics.precision_recall_curve(y_true=y_true, probas_pred=y_score)
precision
array([0.75 , 0.66666667, 1. , 1. , 1. ])
recall
array([1. , 0.66666667, 0.66666667, 0.33333333, 0. ])
threshold
array([0.8 , 0.88, 0.9 , 0.98])
描画するには sklearn.metrics.PrecisionRecallDisplay が便利です。
metrics.PrecisionRecallDisplay.from_predictions(y_true, y_score, name="Your Classifier")
<sklearn.metrics._plot.precision_recall_curve.PrecisionRecallDisplay at 0x7f1c43cbc250>